The problem statement is to find the efficiency of bank branches using the net average surplus of all branches and find the in-out transaction of a specific branch.
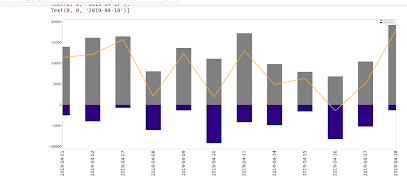
First We analyse the data which contains details of all the branch’s transactions. And find the In -out transaction per day and also find the total surplus per day. For this first of all, we group the data based on the branch so we can do operations specific to the branch. We split the data into two dataframe checkin and checkout. Applying data reprocessing, then sum of the amount with the same date so we can have the total checkin_amount and checkout_amout per day. And merge these two dataframe and add a new column named net_amount which indicates the total surplus per day. And finally plot this. (See the screenshot )
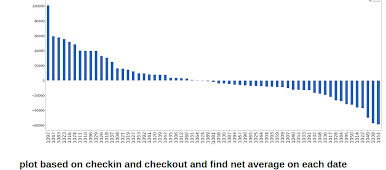
Then the second one is finding which branch is more efficient. For this we use the newly created grouping data frame which have columns like branch, checkin_amount, checkout_amount, net_amount. so we first do the sum of the net_amount of a specific branch and create a new dataframe with the column branch, net_average. And Plot the bar chart which defines the top to bottom branches.


