A prominent provider of advanced data analysis solutions.
Customer Background
It is a prominent provider of advanced analysis solutions. They specialize in transforming raw data from various sources* into actionable business insights. By leveraging state-of-the-art tools and methodologies, they enable businesses to make informed decisions based on comprehensive data analysis.
Objective
To streamline financial analysis by centralizing data from multiple sources, enhancing the precision and efficiency of financial as well as multi-domain insights, and facilitating quicker decision-making processes.
Challenges Addressed
Businesses faced several challenges in its financial data analysis processes:
Strategic Insights Hindered by Limited Multi-Year Comparisons
Difficulty in deriving essential insights from historical data spanning multiple years into a single view.
Data Volume Constraints Compromising Analysis Precision
Large volumes of data undermining the accuracy and efficiency of analyses.
Operational Inefficiencies from Fragmented Data Sources
Fragmented data across multiple Excel reports causing operational inefficiencies and impeding cohesive analysis.
Delayed decision-making
Time-intensive data compilation processes delaying crucial decision-making timelines.
Inability to Scale Analysis with Business Growth
Existing methods proving inadequate in scaling up to meet the demands of expanding business operations.
Solution
To address these challenges, a comprehensive solution involving multiple phases and teams was developed:
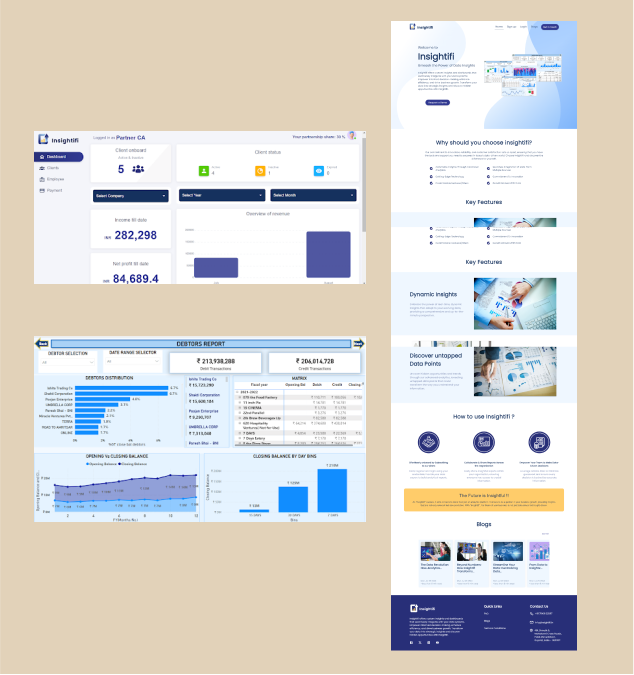
Dynamic Data Visualization:
Utilized cutting-edge tools for dynamic, insightful multi-year comparisons.
Efficient Data Management:
Implemented robust systems to handle large volumes of data, ensuring precise financial analysis.
Centralizing Data Repositories:
Unified scattered data into integrated repositories, promoting seamless collaboration and a holistic financial view.
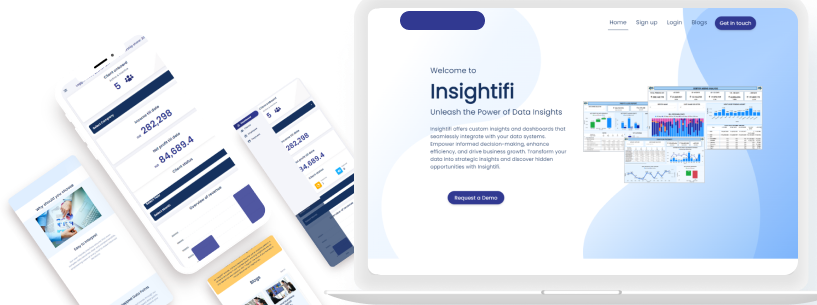
Cross-Platform Accessibility:
Ensured cross-platform accessibility for multi-domain data, allowing stakeholders to stay informed anytime, anywhere.
Interactive BI Dashboards:
Developed interactive BI dashboards providing insights at the stakeholders' fingertips.
Technology and Tools
Insightifi utilized a range of technologies and tools to build the platform:
Frontend/Backend:
Frontend - Node.js
Backend - Next.js
Backend - Next.js
Tools Use:
Power BI Desktop,
Spreadsheets (Excel sheets)
Google Drive (like cloud storage)
Google Drive (like cloud storage)
Result
The implementation resulted in significant improvements in their financial analysis capabilities:
Enhanced User Experience:
Provided a new user interface with a streamlined workflow for order placing, management, and delivery scheduling.
Increased Revenue:
Revenue increased by over 80% through improved design, navigation, and the addition of rental and financing options.
Improved Decision-Making:
Enabled quicker and more informed decisions with real-time data updates, reducing delays.
Better Market Reach:
Improved site availability and uptime, reaching the target audience more effectively.
This case study showcases how the software tackled their data analysis challenges by implementing a robust, scalable, and efficient solution that significantly improved their decision-making processes and operational efficiency.