5G: Driving force supporting for India’s 5 Trillion $ Economic Vision by 2025
May 23, 2023
Deploying E-Commerce application with nopCommerce: Open-Source platform
January 5, 2024
What is Data Modeling?
Data Modeling is one of the features used to connect multiple data sources using a relationship. A relationship defines how data sources are connected with each other and you can create interesting data visualizations on multiple data sources.
In data visualization, the ultimate goal is to create actionable insights from data. To achieve this, it’s essential to have a data model that can support effective analysis and reporting. The star schema is one such data model that has been widely used for data visualization projects.
What is Star Schema?

A star schema is a relational database schema that is designed to represent a single fact table and multiple dimension tables. In this schema, the fact table contains numeric measures or facts, such as sales revenue or website traffic, while the dimension tables contain descriptive attributes or dimensions, such as time, product, or location.
Lets understand with an example,
We have a data representing daily sales for an All-in-One store.
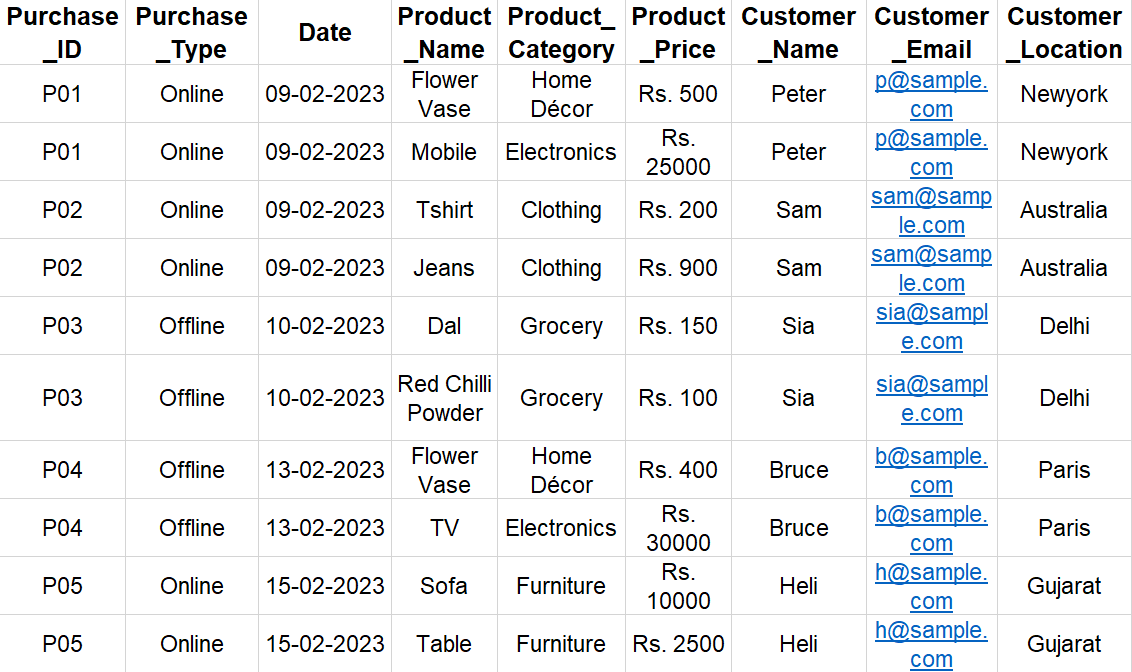
In the above dataset all the transaction details are stored in one table which means the data is highly denormalized.
What is Denormalized data?
Denormalized data refers to data that has been intentionally or unintentionally organized in a way that includes redundancy. This means that some data may be stored in multiple places or tables, which can make it more difficult to manage and update. To solve this data redundancy issue we need to normalize the data.
What is Normalization?
Normalization is the process of organizing data in a structured way to reduce redundancy and improve data consistency. This involves breaking down larger tables into smaller, more specific tables and defining relationships between them.
Using this process, We can create a structured and scalable star schema that supports efficient querying and fast performance.

Normalizing data is important for several reasons, including:
- Reducing Data Redundancy
- Avoiding Data Anomalies
- Improving Query Performance
- Enforcing Data Integrity
- Adapting to Future Changes
Why is the Star Schema Ideal for Data Visualization?
The star schema is an excellent choice for data visualization projects for several reasons:
- Simplifies Querying: The star schema simplifies queries, making it easier to join tables and retrieve data. Because each dimension table is connected to the fact table through a one-to-many relationship, it’s easy to aggregate data by any combination of dimensions.
- Performance: The star schema is optimized for query performance. Because the fact table contains only numeric measures, and the dimension tables contain only descriptive attributes, the queries can be executed quickly.
- Reduces Redundancy: The star schema reduces data redundancy, making it easier to maintain and update. Each dimension table contains only unique attributes, and the fact table contains only the primary keys of the dimension tables.
- Scalability: The star schema is scalable, making it an excellent choice for large datasets. As the volume of data grows, the schema can be expanded by adding new dimension tables and connecting them to the fact table.
- Visualization: The star schema is designed to support data visualization projects. The structure of the schema makes it easy to create charts, graphs, and other visualizations by selecting the appropriate dimensions and measures.
Leveraging Star Schema in Data Visualization Projects
To leverage the star schema in data visualization projects, you need to follow some best practices:
- Design the Schema Carefully:
The star schema’s success depends on how well it’s designed. Therefore, it’s essential to understand the business requirements and design the schema accordingly. Identify the fact table and the dimension tables and define the relationships between them. Make sure the schema is optimized for performance and scalability.
- Choose the Right Visualization Tool:
Select a visualization tool that can handle star schema data. Many popular data visualization tools, such as Tableau, Power BI, and QlikView, support star schema data.
- Choose the Right Dimensions and Measures:
Identify the relevant dimensions and measures for the visualization project. The dimensions should be descriptive attributes that provide context for the measures. The measures should be numeric values that can be aggregated.
- Use Filters and Drill-Downs:
Use filters and drill-downs to make the visualizations more interactive. Filters allow users to select specific dimensions or measures, while drill-downs allow users to explore the data at a more granular level.
- Use Best Practices for Visualization Design:
Follow best practices for visualization design, such as using appropriate chart types, avoiding clutter, and using color effectively. Make sure the visualizations are easy to understand and provide actionable insights.
Conclusion
The star schema is a powerful data model that simplifies data analysis and visualization. It helps create a structured, organized, and scalable database that supports efficient querying and fast performance. While other schema models like snowflake schema can also be used for data visualization projects, they have their own unique advantages and disadvantages depending on the specific use case. Ultimately, the choice of schema will depend on the nature and complexity of the data, the business requirements, and the available tools and resources. However, the star schema remains a popular and effective choice for data visualization projects due to its simplicity, efficiency, and flexibility.