Power BI : Recent Features: (2021)
May 12, 2022
Overview and Usecases of ChatGPT
March 29, 2023By: Team Cilans
info@cilans.net
What are Infographics?
Infographics are graphic visual representations of information, data, or knowledge intended to present information quickly and clearly. They can improve cognition by utilizing graphics to enhance the human visual system’s ability to see patterns and trends.
Infographics is custom tool in PowerBI
How to Create?
Follow below path to load Infographics tool in PowerBI Desktop.
Insert >> MoreVisuals>> From AppSource
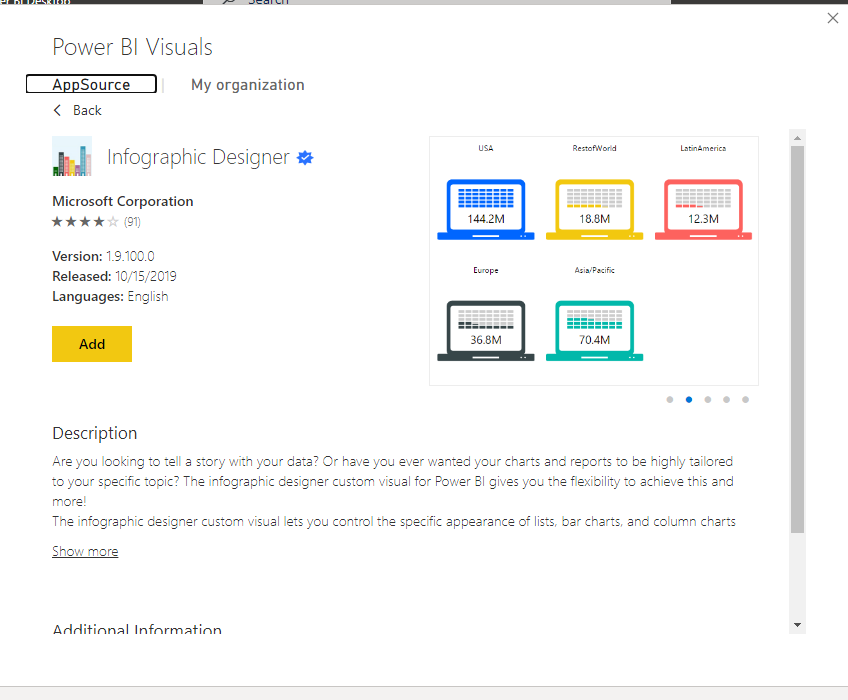
Click Add button to Add infographic tool in your PowerBI Desktop.
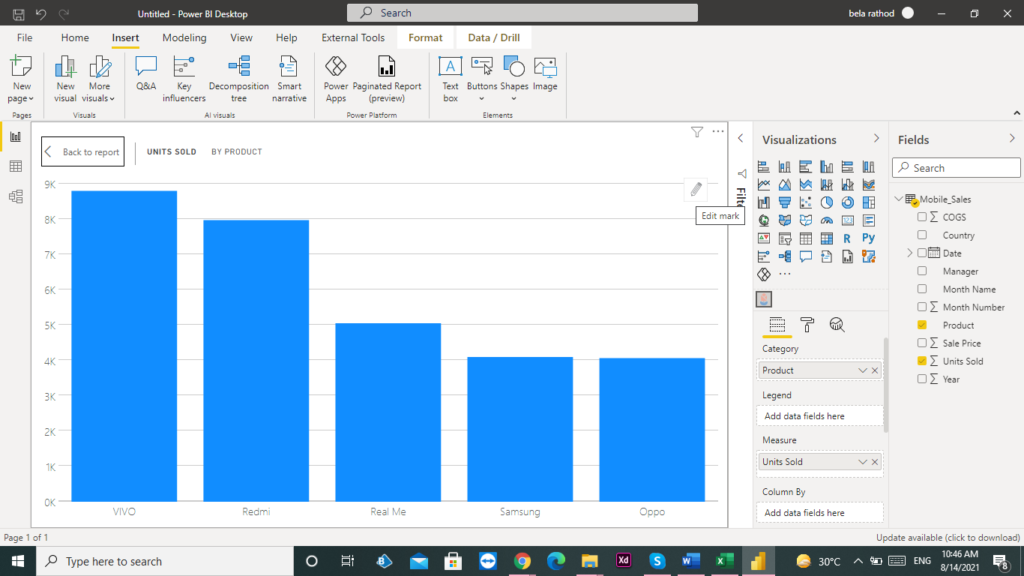
Plot Unit sold By Product
Edit button in the top right-hand side.
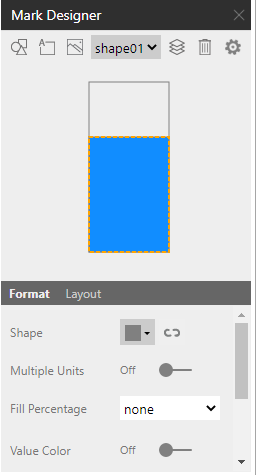
Click on that, and this will bring up a menu that allows you to stack and change the shapes.
This menu represent different formatting apply to Infographics chart
Click insert Image icon to upload different image for our product. (Download .svg Image).
click this Icon To configure Image for Product.

1.Infographics Unit Sold by Product.

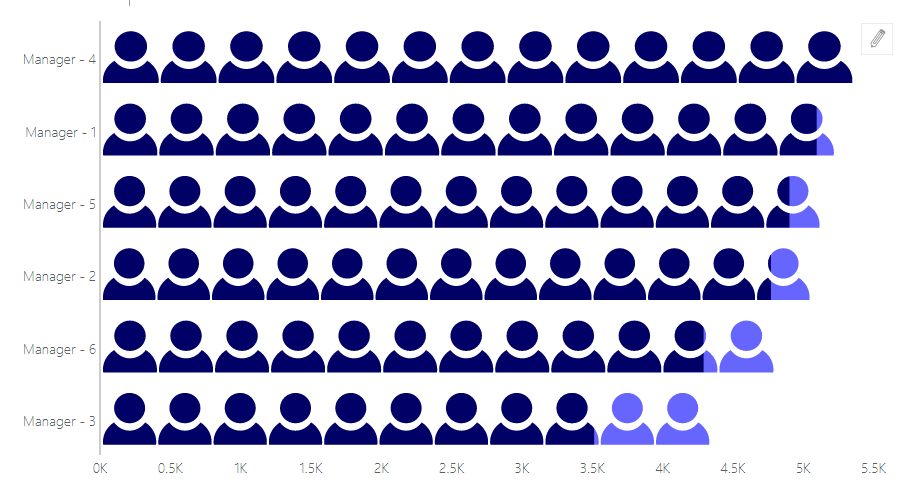
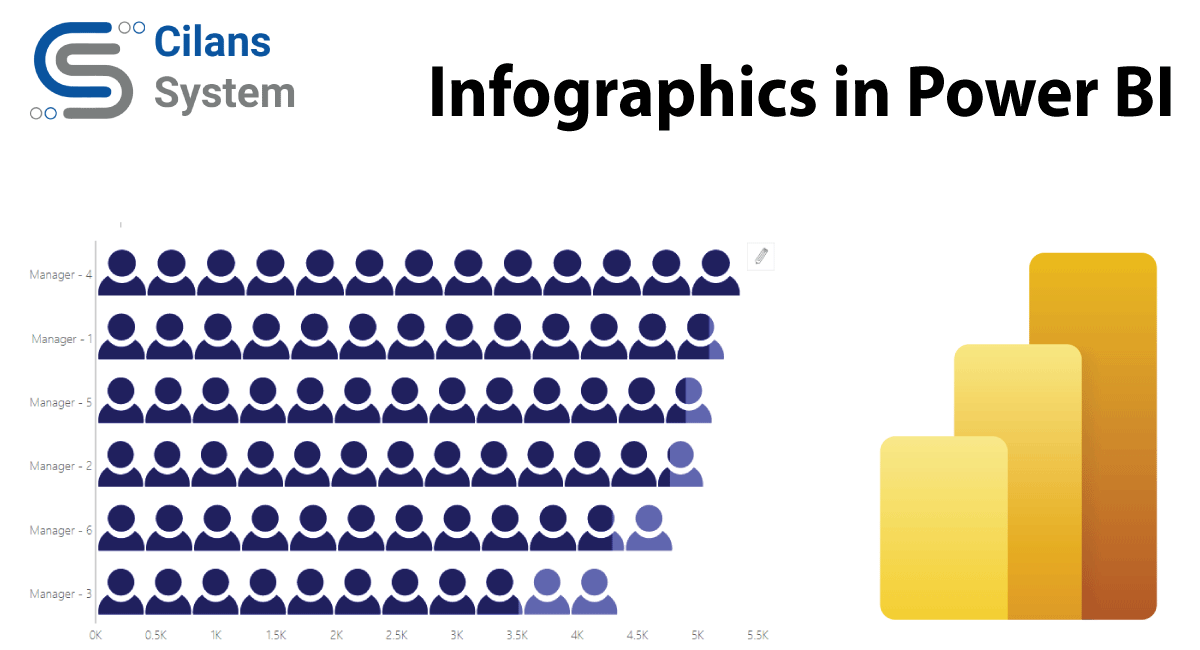
2. Infographics Unit Sold by Manager
